Guest post by our friends at RateHub.ca
One of the best things you can do for your clients is stay on top of what’s happening in your market, right? But have you thought about what it could mean for them, and for you, if you also kept up with the trends of Canadian mortgage rates?
We recently launched a historical mortgage rates chart builder you can embed on your site to do just that. On top of adding a visual to your content, the chart builder is a unique research tool you can use for stories you write in the future.
After some initial feedback, we updated the tool to pull in more timely data. For example, if you wanted to show your clients how fixed mortgage rates are increasing as bond yields rise, you would want a visual that includes this week’s data.

Variable Mortgage Rates Surge in Popularity
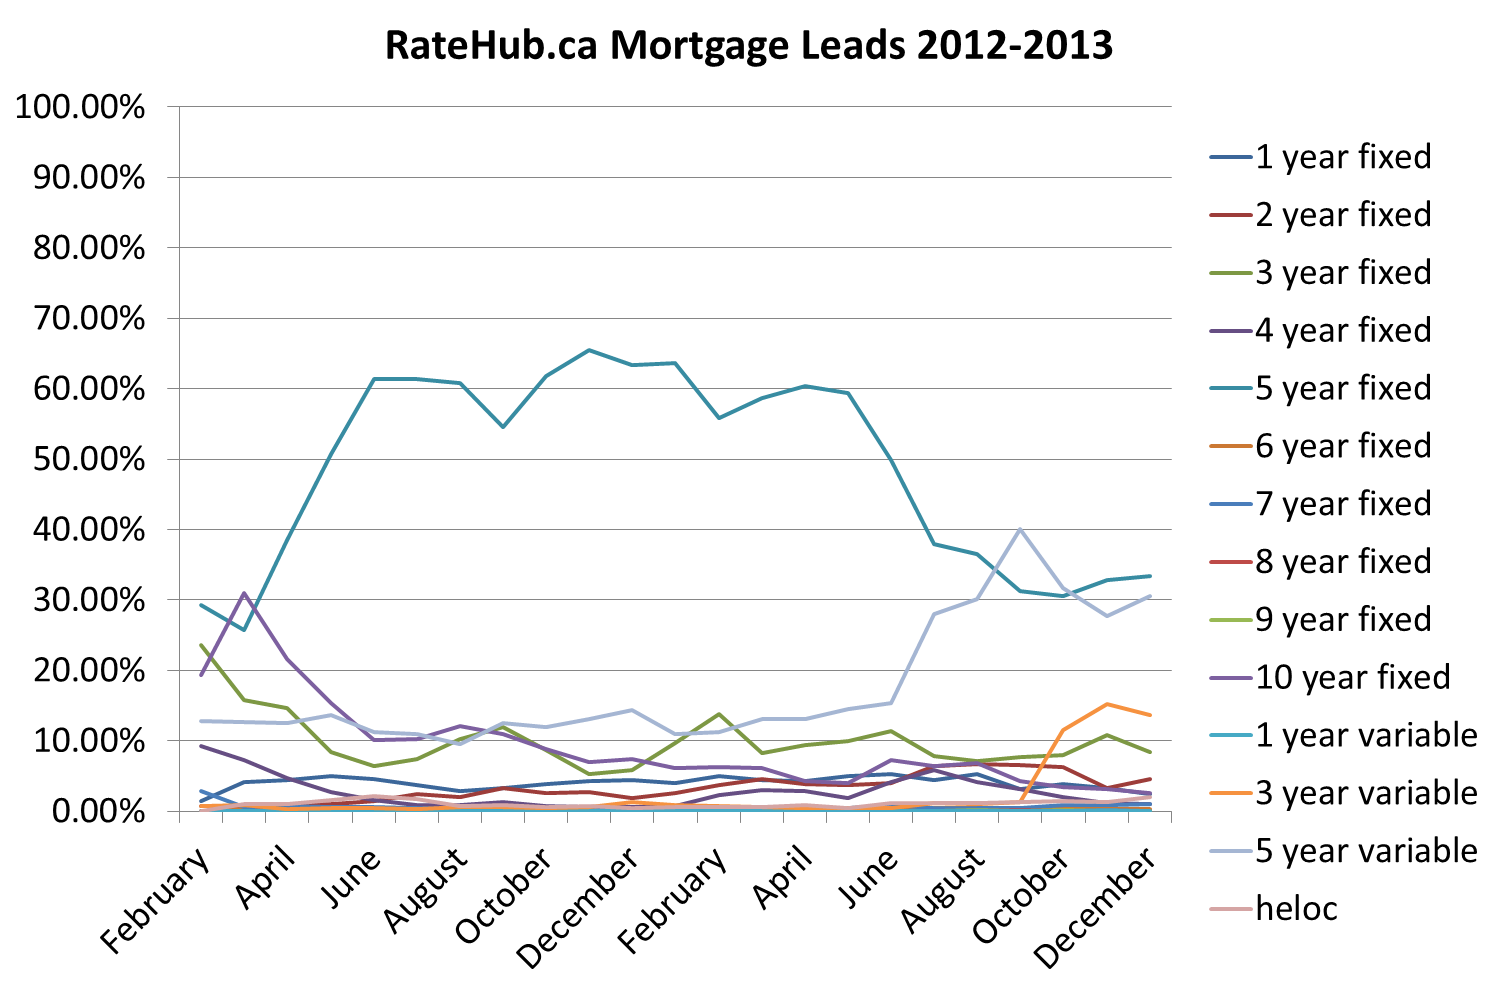
In the spirit of finding insights on the mortgage market by using this tool, here’s something we recently discovered. We know the spread between variable and fixed mortgage rates has widened since the beginning of the year.

What we wanted to figure out, however, is whether or not that spread has influenced borrower decisions. As it turns out, it has. According to our mortgage lead data, 5-year variable mortgage rates have surged in popularity, from just over 10% to more than 30% over the course of this year (and hit 40% in the fall).
Why Your Clients Care
Your clients are homeowners – or at least they hope to be. As such, they likely have mortgages. And if they’re in Vancouver, they’re paying off some of the largest debts any Canadian will hold. It’s your job to help them find their dream home, but you could help them even further by improving your expertise of the mortgage market. By providing valuable content for your clients, you improve your value as their realtor.
How to Build the Charts
The charts are easy to build and can be embedded on any website:
- You select one piece of data you want to look at (i.e. Prime rate), or compare multiple sets of historical mortgage rate data (i.e. posted vs. discounted 5-year rates).
- Add a date range.
- Style it to create your own personalized chart.
- Copy the code, paste it to your site and you’re done!
For more information, visit our historical mortgage rates widget page on ratehub.ca.


